ntsa.bifurcation
At a glance
| Function | One-liner |
|---|---|
bifurcation_sweep(model, param, values, ...) |
Parameter sweep collecting observable extrema: one ensemble forecast — member k at values[k] — by default, or serial branch-following with continuation=True. |
plot_bifurcation(values, peaks, ...) |
Bifurcation diagram from bifurcation_sweep output. |
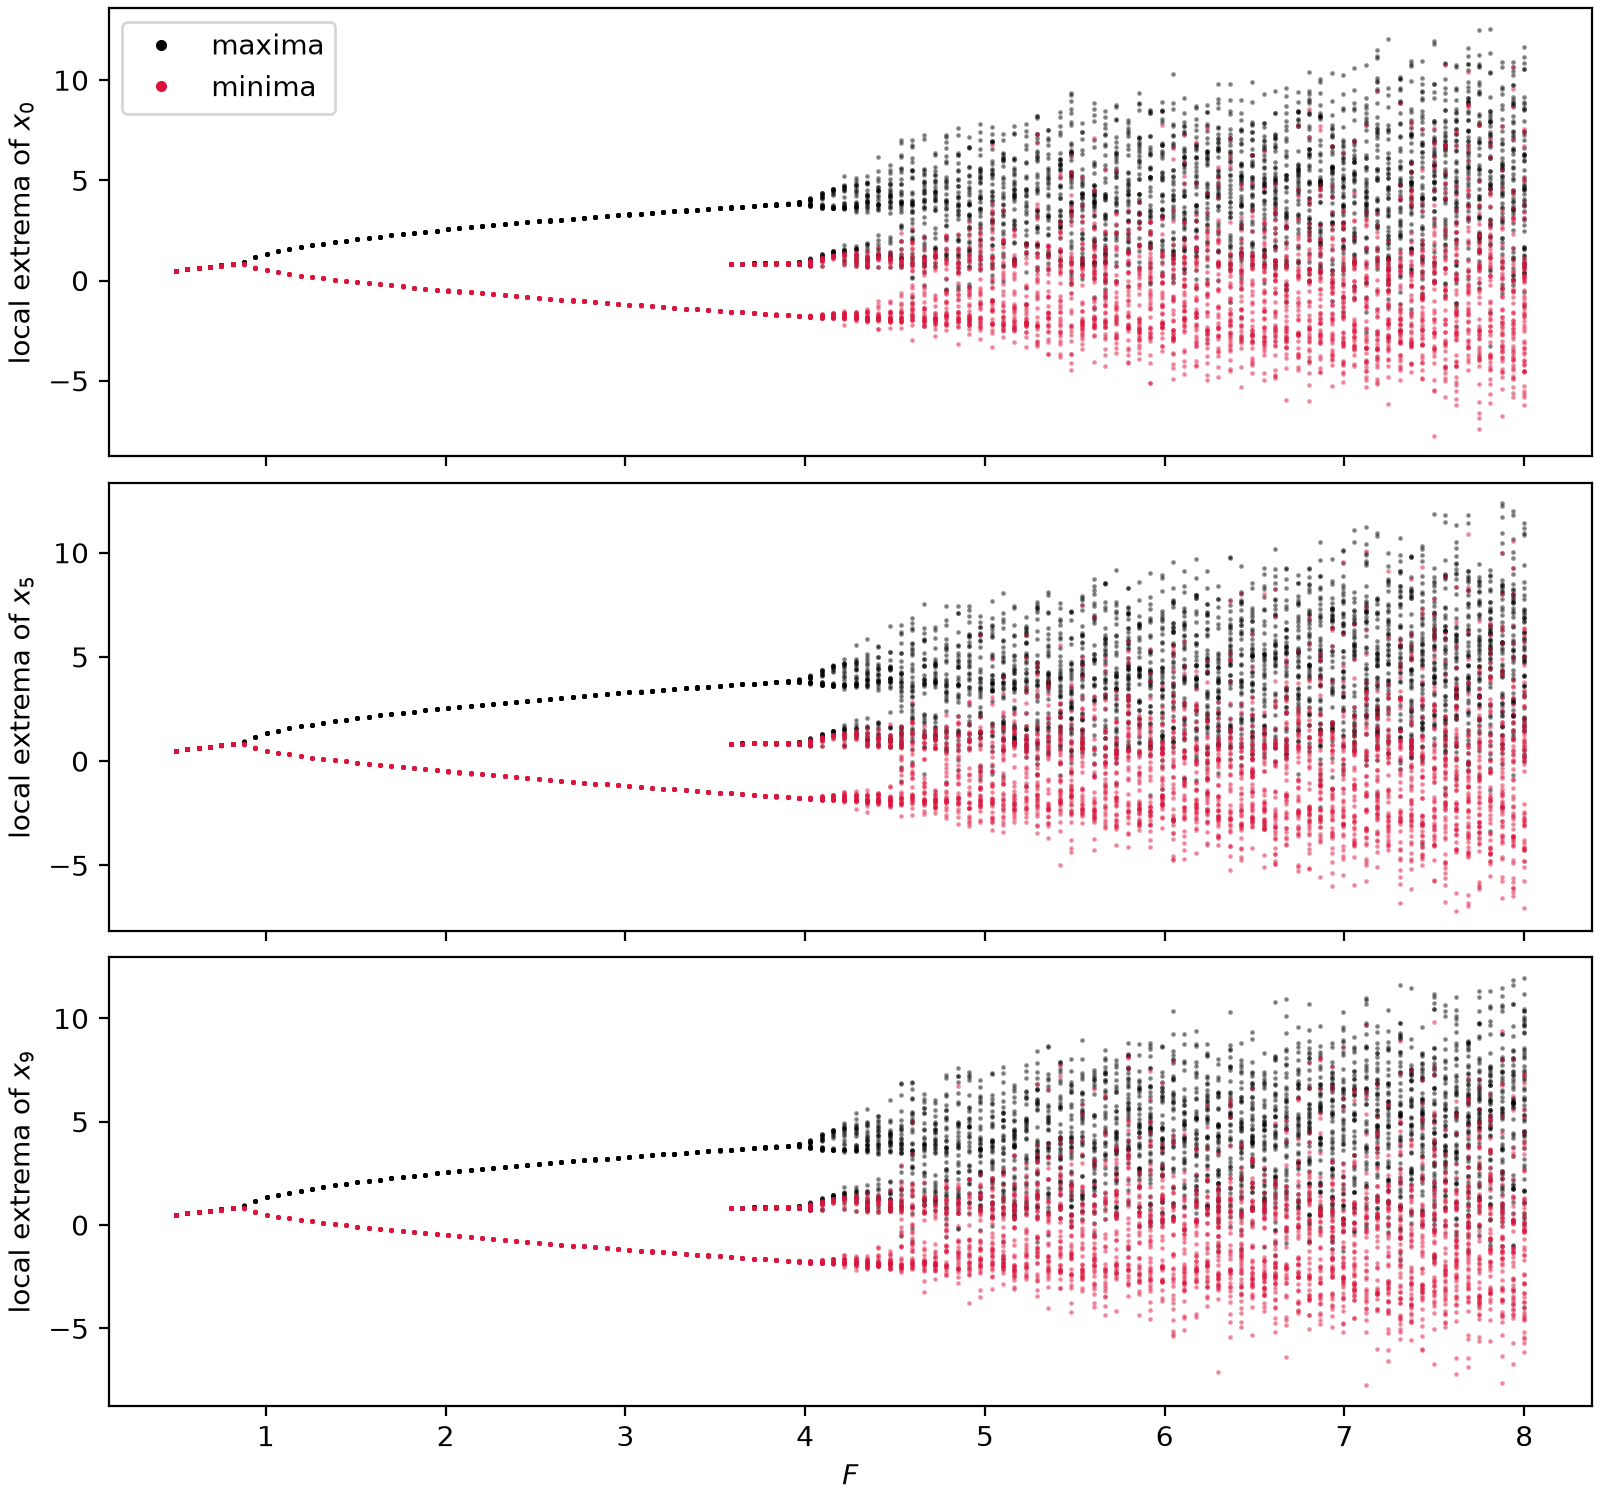
Produced by the module demo: python -m ntsa.bifurcation --model lorenz96 --save-figs.
Full reference
ntsa.bifurcation
Bifurcation sweeps and diagrams.
Run as a script for a bifurcation-diagram demo, e.g.::
python -m ntsa.bifurcation --model lorenz63 --param rho --pmin 20 --pmax 100 --save-figs
bifurcation_sweep(model, param, values, dt=None, t_transient=None, t_sample=None, extrema=('max',), continuation=False, seed=0, **overrides)
Sweep param over values, collecting local extrema of every observable.
By default the whole sweep is ONE ensemble forecast: every parameter value
shares the same initial state, param is augmented into the state
(init_ensemble(est_alpha=[param])) and member k integrates at
values[k] — the integrator parallelizes across parameter values in a
single run. With continuation=True it falls back to a serial m=1 loop
where each run starts from the previous endpoint plus a small perturbation —
the classic way to follow an attractor branch (e.g. through a hysteresis),
and inherently sequential.
Returns:
| Name | Type | Description |
|---|---|---|
values |
ndarray
|
|
peaks |
dict
|
|
Source code in ntsa/bifurcation.py
20 21 22 23 24 25 26 27 28 29 30 31 32 33 34 35 36 37 38 39 40 41 42 43 44 45 46 47 48 49 50 51 52 53 54 55 56 57 58 59 60 61 62 63 64 65 66 67 68 69 70 71 72 73 74 75 76 77 78 79 | |
plot_bifurcation(values, peaks, param_label, obs_labels, filename=None)
Bifurcation diagram: one axis per observable, extrema vs parameter.
Source code in ntsa/bifurcation.py
82 83 84 85 86 87 88 89 90 91 92 93 94 95 96 97 98 99 100 101 | |